KBR Stock: Performance and Outlook
KBR has an assorted mix of business portfolios, which helps it combat cyclicality associated with any single market.
Dec. 22 2017, Published 7:44 a.m. ET
KBR stock
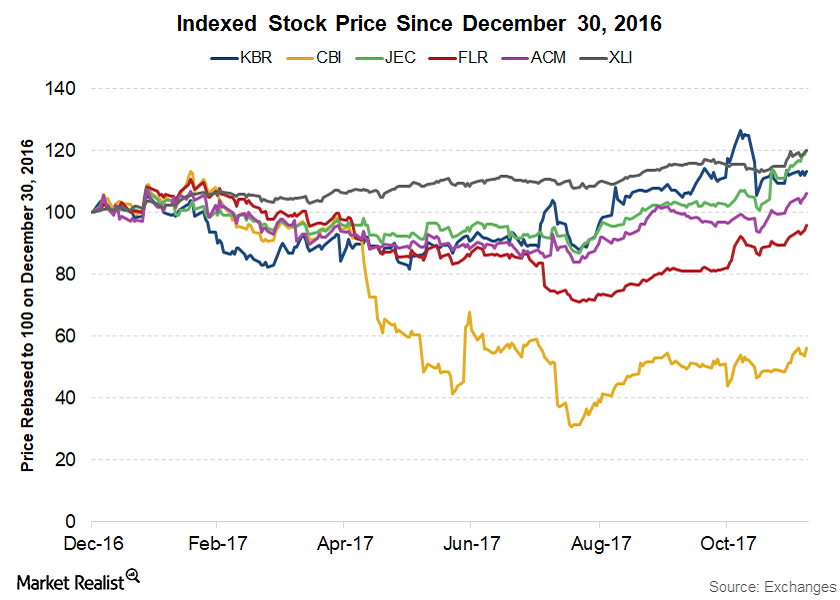
Before ending our coverage of KBR (KBR), let’s take a look at the performance of its stock since the start of 2017.
As of December 8, 2017, KBR stock has risen 13.4% YTD (year-to-date). It has improved since reaching a low of $11.99 on February 2, 2016.
Peer performances in 2017
Fluor (FLR) stock has fallen 4.1% YTD as of December 8, 2017. Chicago Bridge & Iron (CBI) has fallen 43.7% YTD. Since the announcement of its 4Q16 and fiscal 2016 earnings report on March 1, 2017, CBI stock has fallen due to an earnings miss and a decline in profits. AECOM Technology (ACM) stock has risen 6.1%, and Jacobs Engineering (JEC) has risen 20.1% for the same period.
Among the ETFs, the Industrial Select Sector SPDR ETF (XLI) has risen 20%.
Outlook
KBR has an assorted mix of business portfolios, which helps it combat the cyclicality associated with any single market. KBR currently has strong results, solid project execution, and robust bookings. It’s banking on the capability of its Technology & Consulting and Government Services segments to optimize its growth potential.
KBR is positioned for steady long-term growth with lower risk and improved financial flexibility. It has a high level of secured backlog with solid prospects in 4Q17 into early 2018.