Analyzing The Morning Star And Evening Star Candlestick Pattern
The Evening Star candlestick pattern is also a reversal pattern. The pattern has three candles. It forms at the top of an uptrend. The first candle is any long and bullish candle.
Nov. 27 2019, Updated 7:21 p.m. ET

Morning Star candlestick pattern
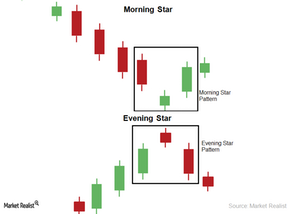
The Morning Star candlestick pattern is a reversal pattern in technical analysis. The pattern has three candles. It forms at the bottom of a downtrend. The first candle is any long and bearish candle. The second candle is a small and indecisive candlestick. The third candle is any long and bullish candle. “Bullish” means the stock price closes above the open price. “Bearish” means the stock price closes below the open price.
The above chart shows the Morning Star and Evening Star candlestick pattern.
During a downtrend, high pessimism causes heavy selling. The pattern’s first candle forms. It’s long and bearish. The indecision between the buyers and sellers forms the second candle. It’s a small candlestick—or a Doji. The expectation of positive stock news in the market forms the third candle. It’s long and bullish. When the volume and stock price increases, it suggests a change in trend.
Evening Star candlestick pattern
The Evening Star candlestick pattern is also a reversal pattern. The pattern has three candles. It forms at the top of an uptrend. The first candle is any long and bullish candle. The second candle is a small and indecisive candlestick. The third candle is any long and bearish candle.
During an uptrend, high optimism causes heavy buying. The first candle forms. It’s long and bullish. The indecision between the buyers and sellers forms the second candle. It’s a small candlestick—or a Doji. The expectation of negative stock news in the market forms the third candle. It’s long and bearish. When the volume increases and the price decreases, it suggests a change in trend.
These patterns are used for trend identification. The Morning Star pattern is used as a buy signal. The Evening Star is used as a sell signal. It’s advisable to use a combination of patterns and indicators to determine your trading strategy.
